EARLINET/ACTRIS campaign during the COVID-19 lock-down and relaxation period.
Published: 21, January, 2021
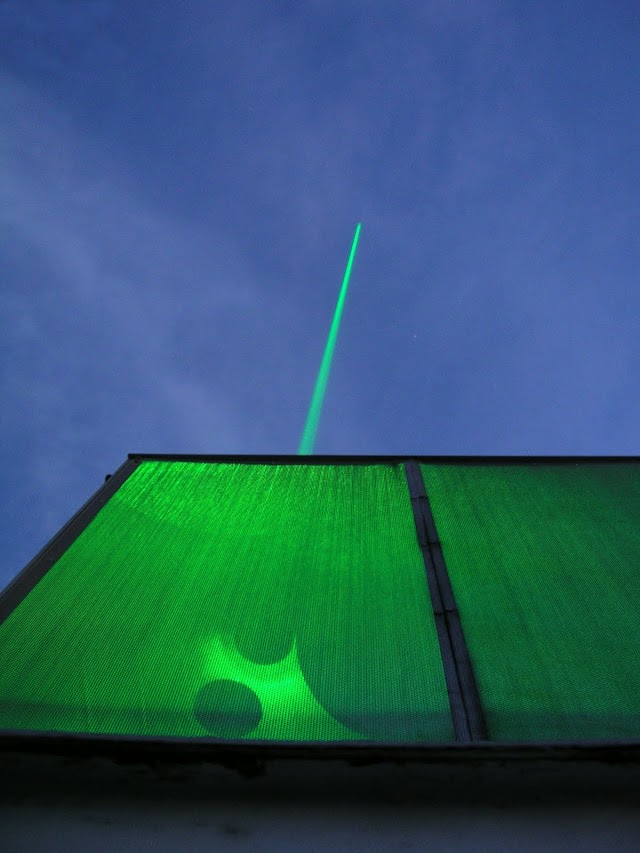
An intensive observation campaign was organized by EARLINET/ACTRIS in May 2020, in order to monitor the atmosphere’s structure during the lockdown and early relaxation period. With their high temporal and vertical resolution, lidars give comprehensive information on the atmospheric structure, its dynamics, and its optical properties. During this campaign, we have also demonstrated the near-real time capability of these instruments.

Twenty-one lidar stations have participated, covering all regions in Europe: from Kuopio (Finland) in the North to Antikythera (Greece) in the South, and from Evora (Portugal) in the West to Bucharest (Romania) in the East. Lidars measured following an intensified schedule, at least twice per day (minimum two hours at noon, and minimum two hours after sunset). For data evaluation, the centralized and automatic processing system (Single Calculus Chain) was used.

The measurements showed that the lock-down did not affected the high troposphere. The usual long-range transport of dust from North Africa to South-West and South-East Europe was mainly contributing to the aerosol load above 3 km. In the low troposphere a certain effect of the lock-down was observed, however within the climatological variability of the month of May. Below 3 km altitude, the aerosol backscatter coefficient was in average lower than usual until the last week of May, with several episodes exceeding the climatological values in the Mediterranean, where long-range transported dust particles were captured by descending air masses.

The values reported for the linear particle depolarization ratio show that pollen, as well as dust transported from North Africa, sometime overlapped with the local aerosol.
You can read the campaign reports here and follow the campaign tweets here.